Structural Integrity
Toolbox
The Toolbox
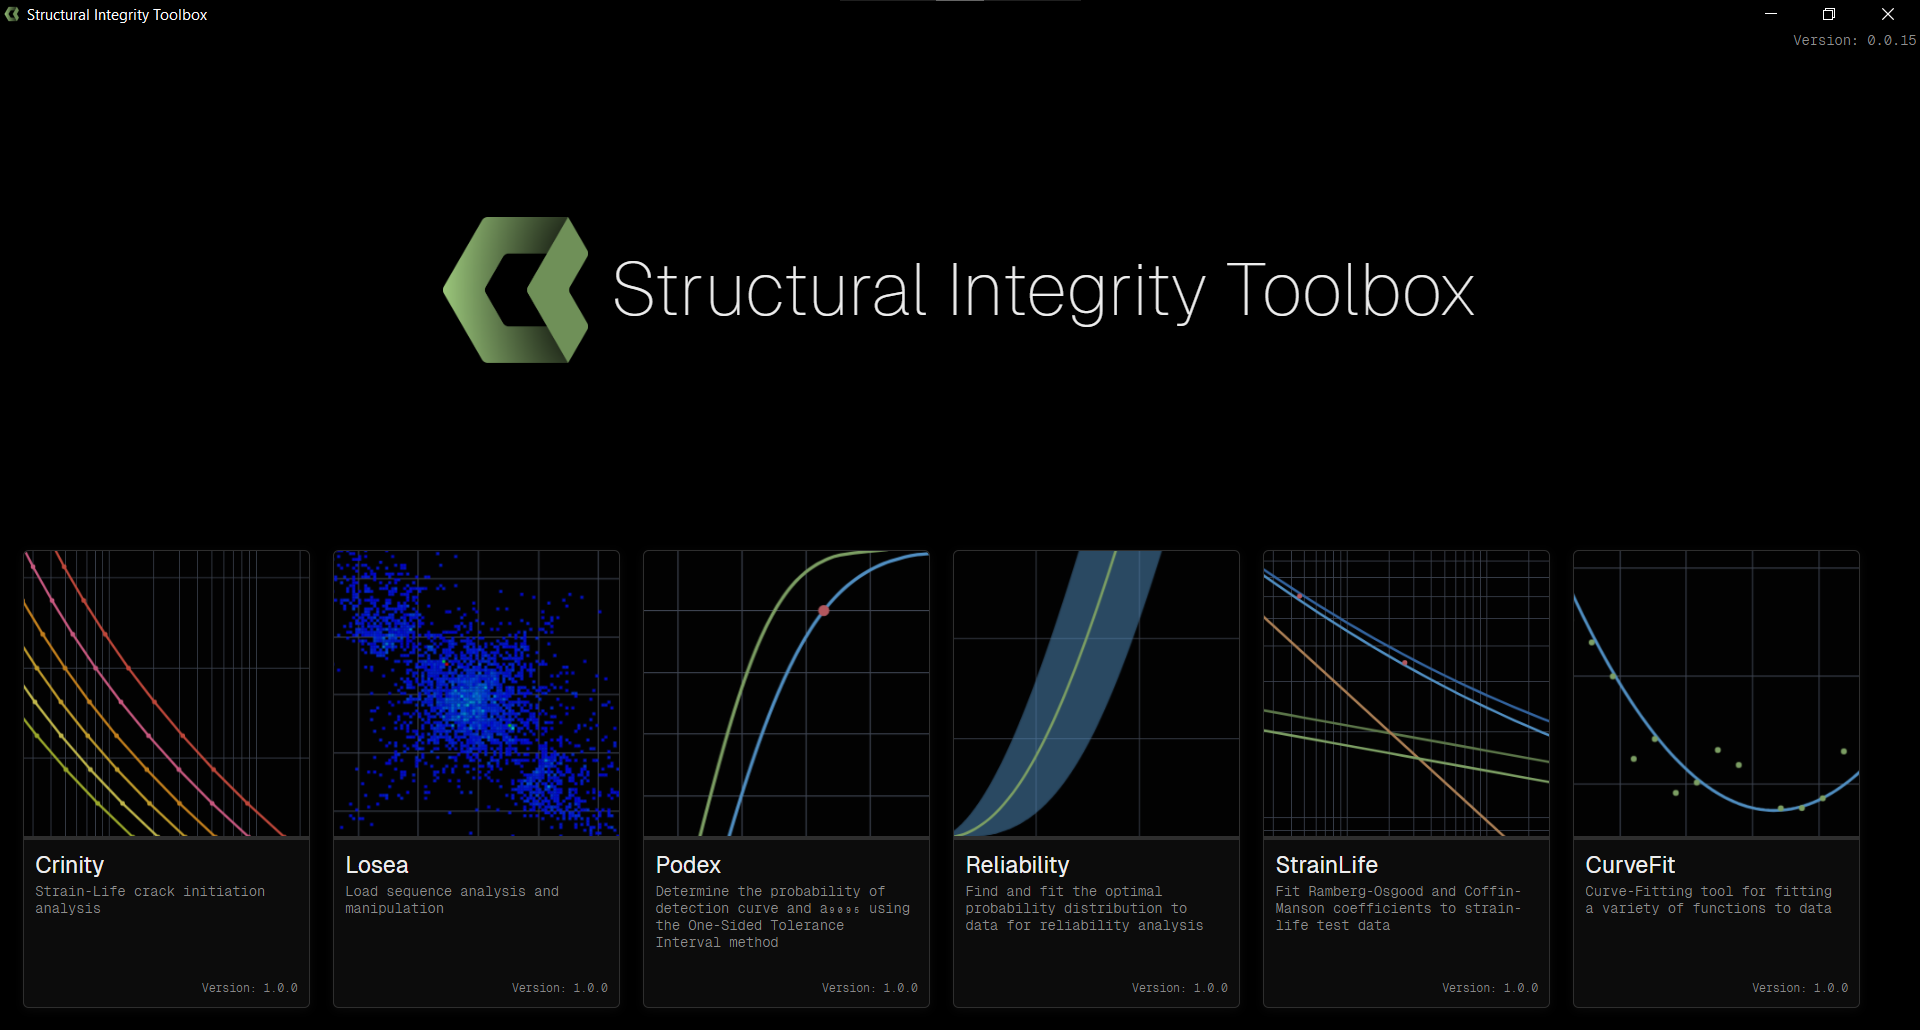
Introducing Crinity: the Structural Integrity Toolbox. Crinity is collection of software tools tailored for applications in the fields of structural health monitoring, reliability engineering, fatigue analysis, and beyond.
The Origin
Crinity was born out of my master's degree in mechanical engineering at Lucerne University of Applied Sciences and Arts (HSLU), where it started as a project for my studies. I found the tools to be incredibly useful in various other projects and believe that it can be beneficial to others as well. I've decided to try to turn Crinity - and my skills to develope software tools - into a business. This site is the first step in that direction.
The Vision
My vision for Crinity is to create tools that engineers can rely on for their data analysis and calculations - tools that are more efficient, reliable, and user-friendly than traditional Python scripts and Excel sheets.
With my background in engineering and a passion for programming, I believe I have a unique combination of skills that allows me to understand the needs of engineers and develop software that meets those needs effectively.
Collaboration
To support my activities, I am continuing the collaboration with Lucerne University of Applied Sciences and Arts (HSLU), which allows for access to a wide range specialist knowledge and expertise.
The Tools
Crinity
Strain-Life crack initiation analysis
01
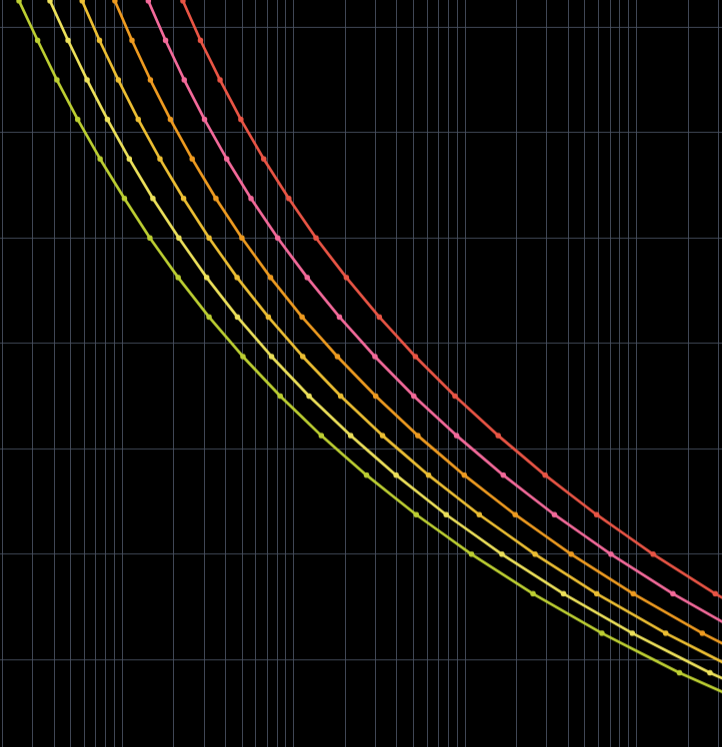
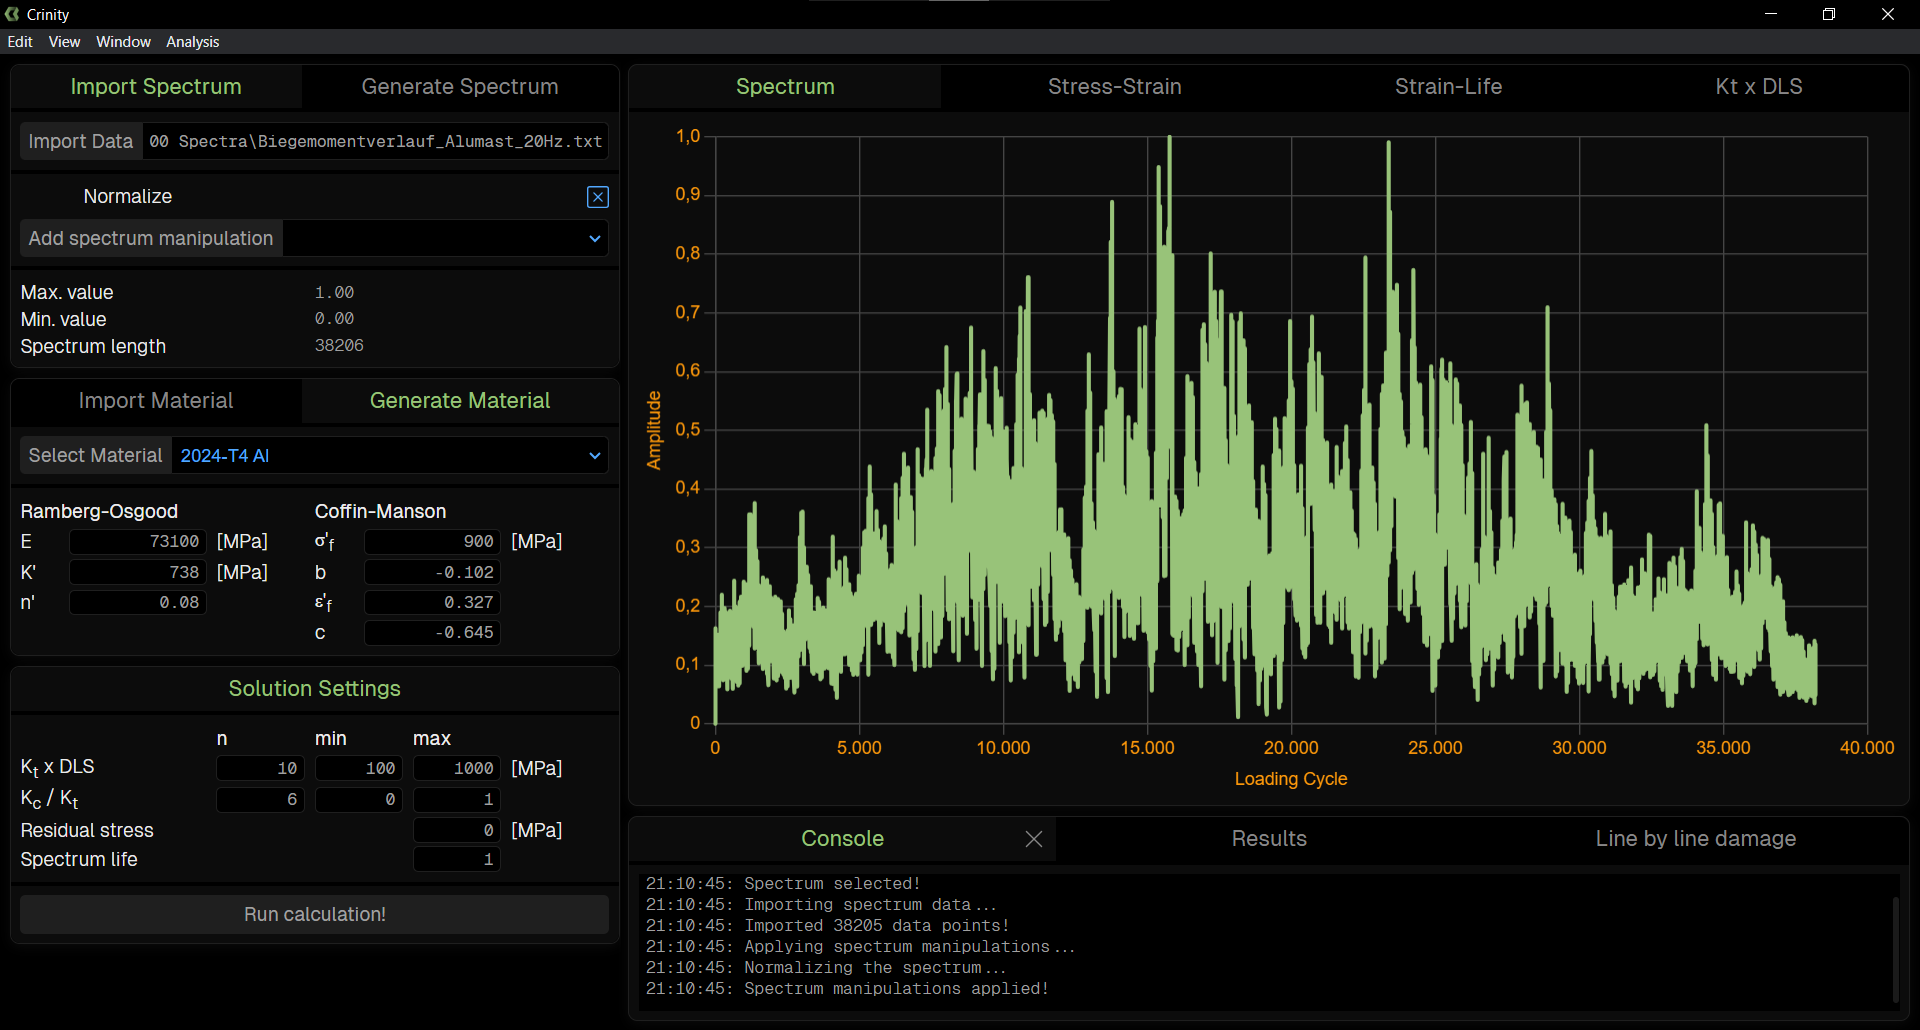
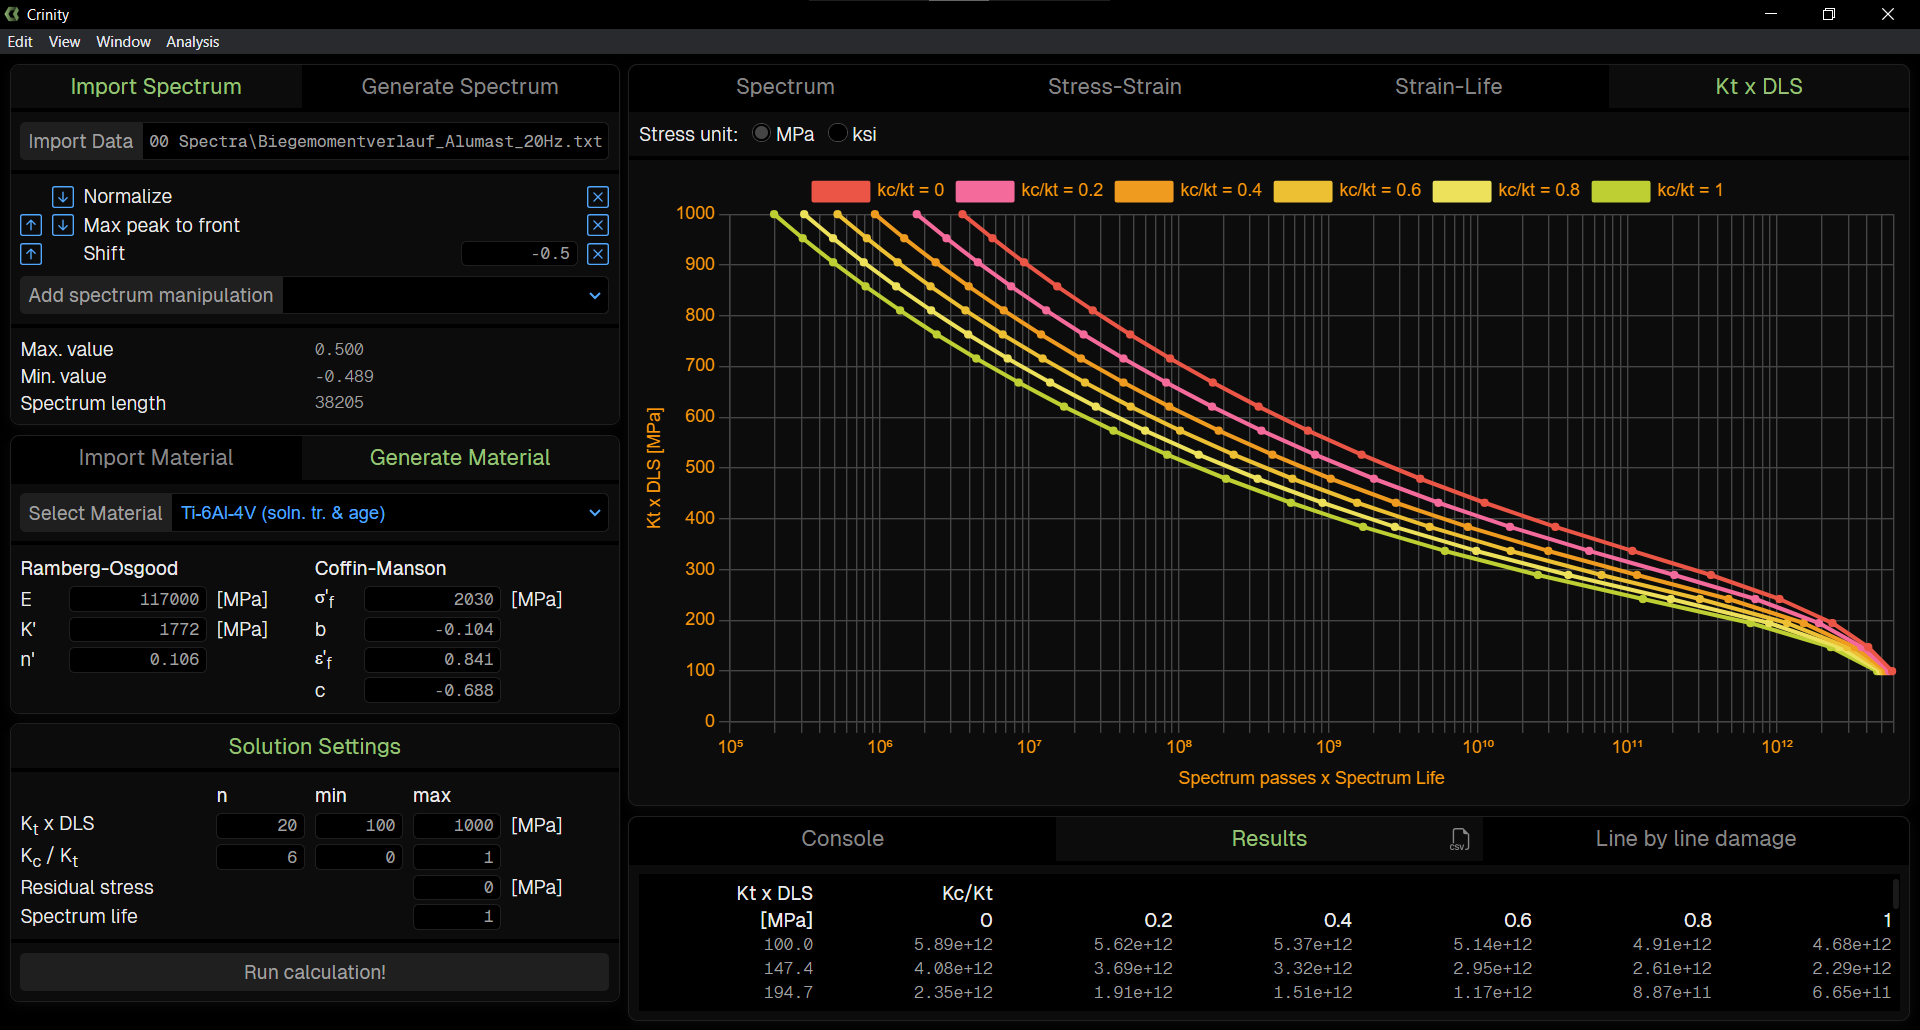
Crinity is a software tool designed for strain-life fatigue analysis. It facilitates fatigue analyses for various geometries, irrespective of available S-N data, by generating Kt x DLS (Design Limit Stress) curves. These curves establish the relationship between the design limit stress and the number of cycles or spectrum passes to crack initiation, enabling accurate predictions of component or material failure. Crinity is built on the strain-life method, Neuber’s rule and Masing’s hypothesis.
Key functionalities include the ability to load and manipulate variable amplitude spectra, create constant amplitude spectra, and print cycle-by-cycle damage results. Tabular material data can be loaded from a .csv file, or material data can be generated using Ramberg-Osgood and Coffin-Manson coefficients.
Losea
Load sequence analysis and manipulation
02
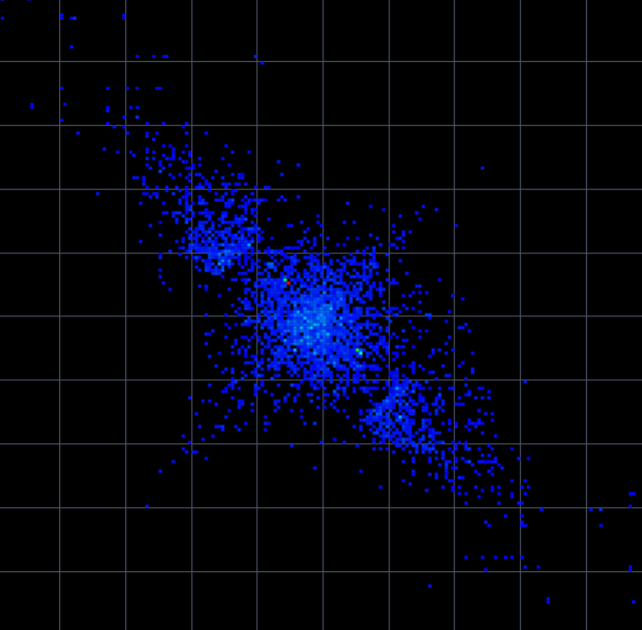
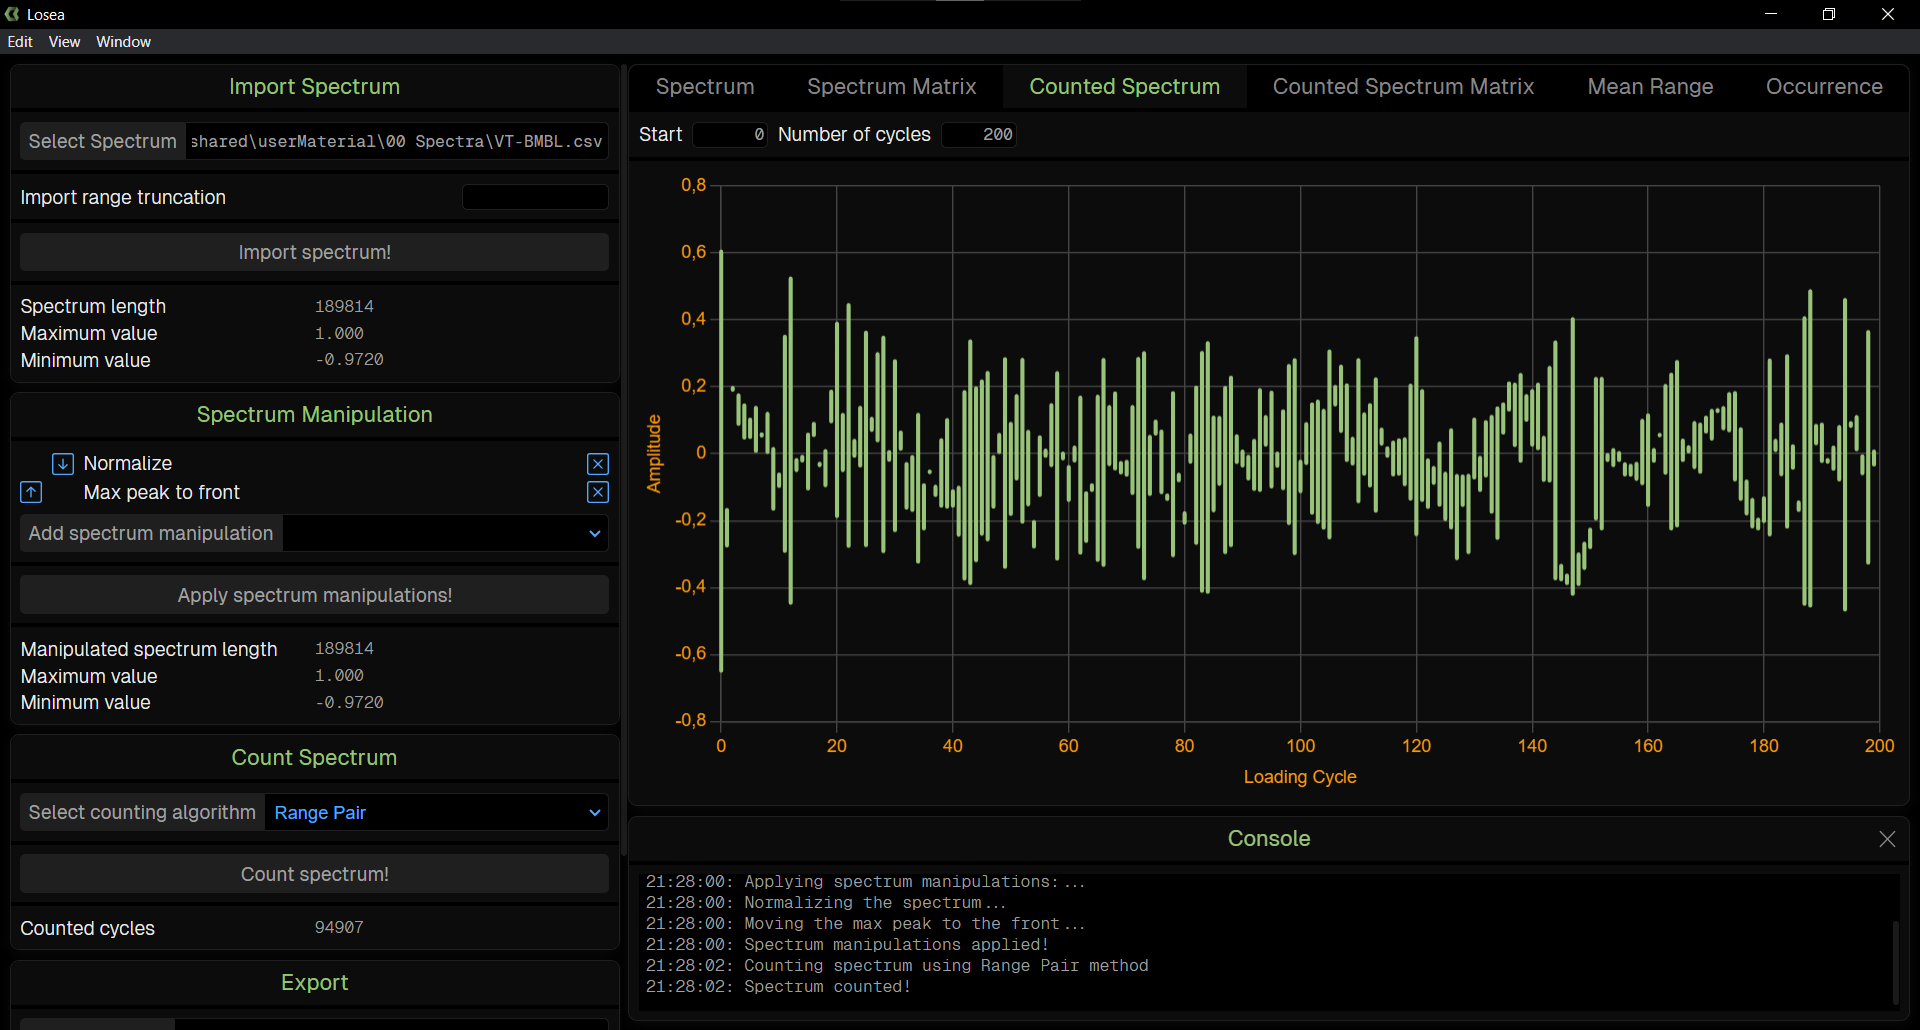
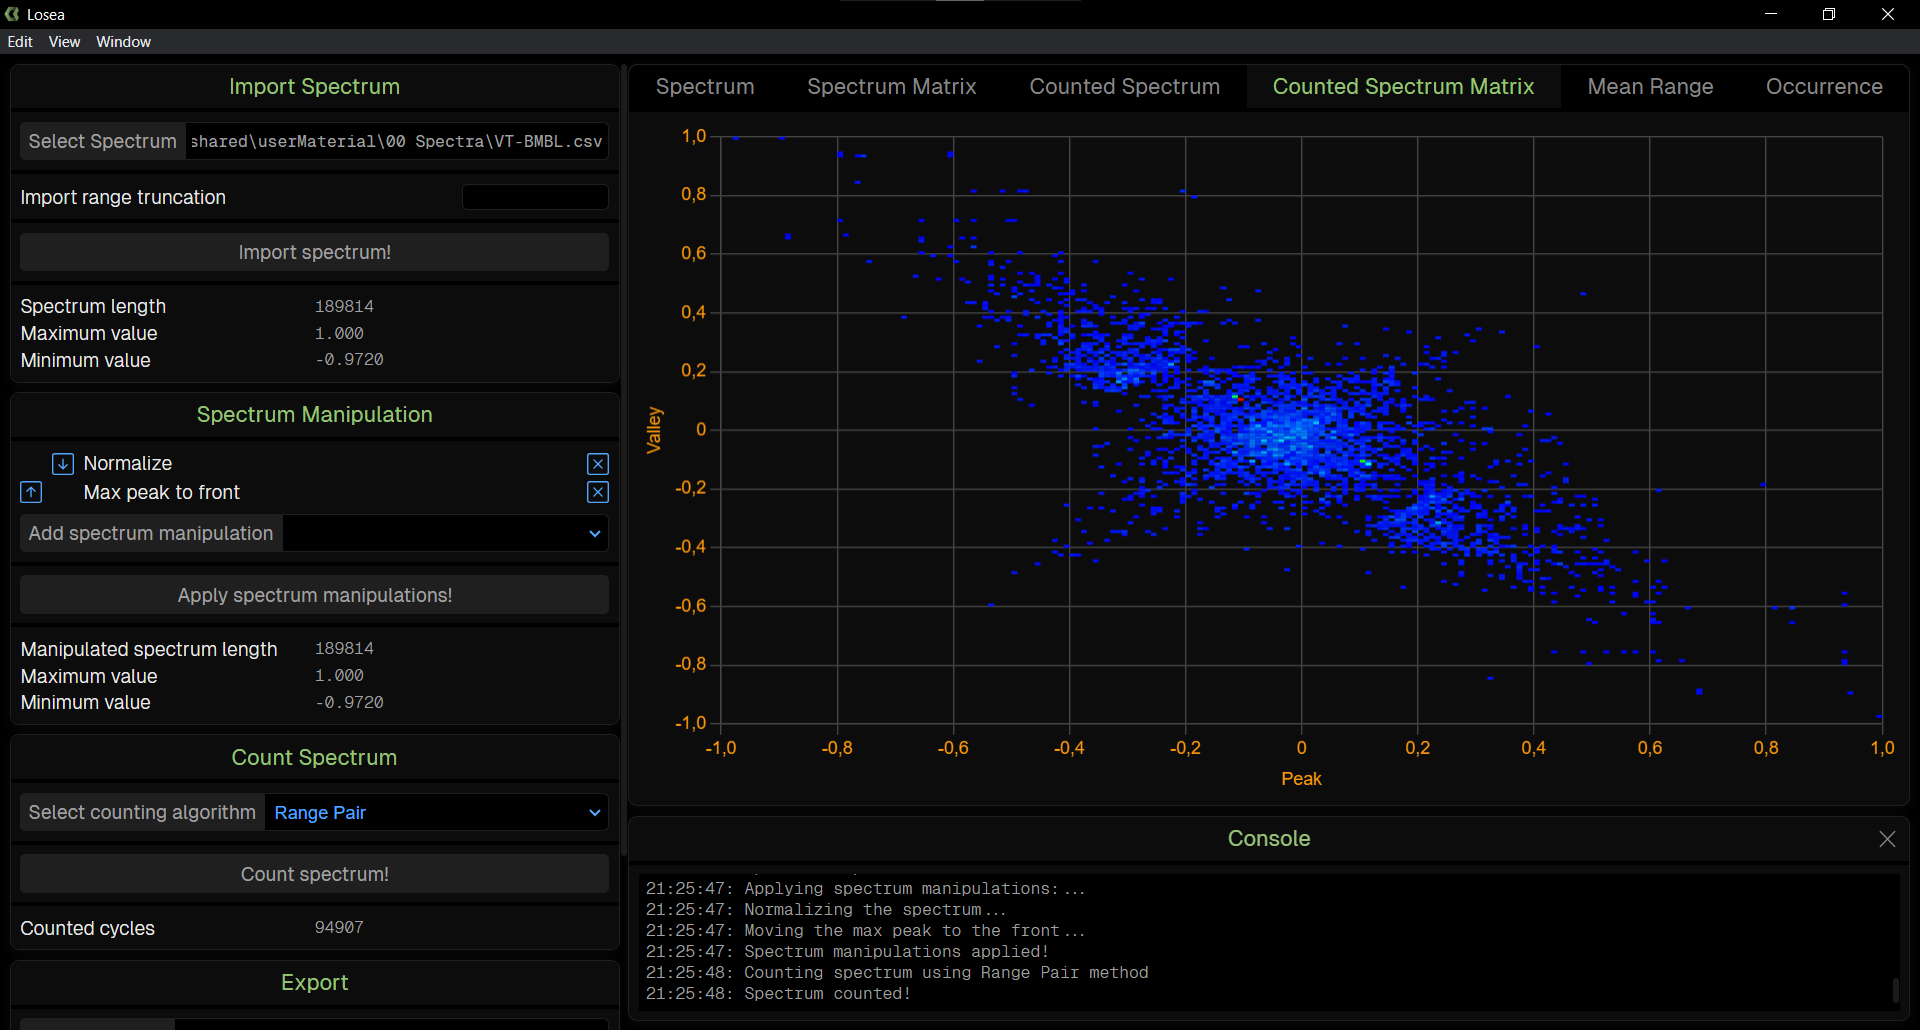
Losea is a tool for analyzing, manipulating, and processing of load sequences and sensor data (E.g., from a strain gauge). It incorporates cycle counting methods such as Range-Pair and Rain flow counting - in accordance with ASTM-E 1049-85 Standard Practices for Cycle Counting in Fatigue Analysis - to analyze spectra data.
The tool allows users to intuitively understand spectra by visualizing the data in various formats. The manipulated and counted spectrum data can be exported in different file types for further processing, including .sub files for use in Afgrow.
Podex
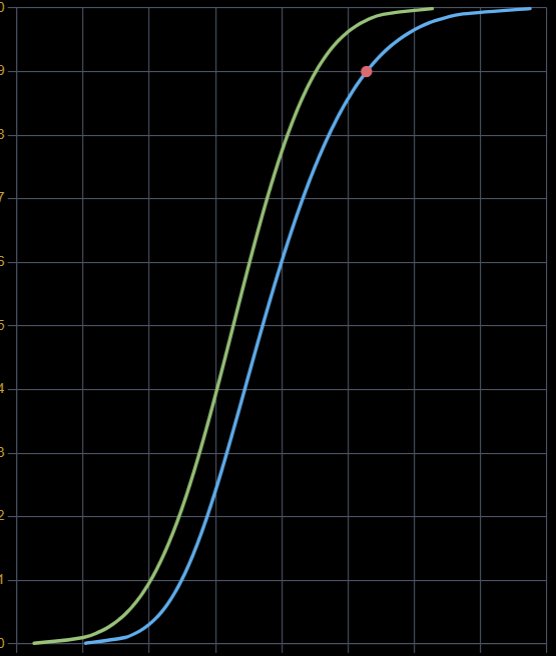
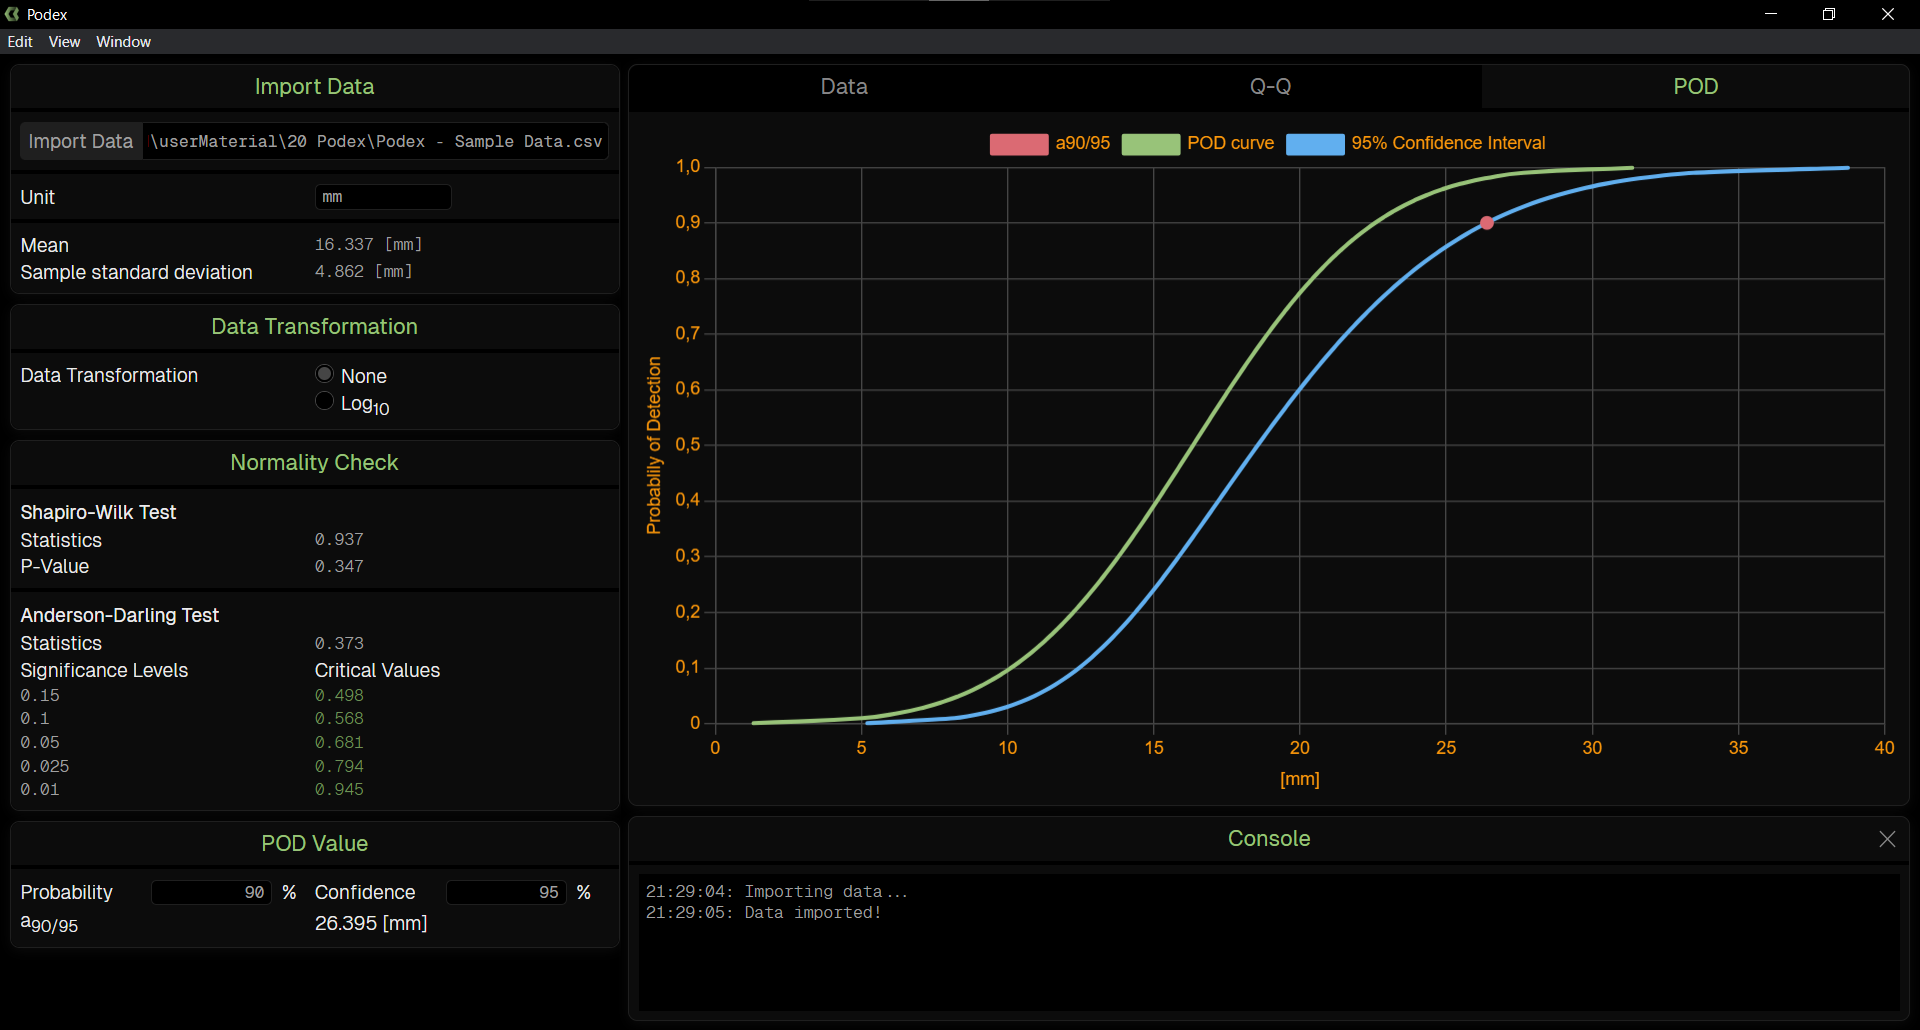
Determine the probability of detection curve and a₉₀₉₅ using the One-Sided Tolerance Interval method
03
The Podex tool is designed to assess the performance of Non-Destructive Testing (NDT) methods or Structural Health Monitoring (SHM) sensor systems by determining the characteristic Probability of Detection (POD) curve. It utilizes the One-Sided Tolerance Interval Probability of Detection (OSTI-POD) methodology to provide a statistical approach to this determination. The tool features a user-friendly interface that verifies the compatibility of the provided data with the POD model assumptions and informs users if the OSTI-POD method is applicable. The tool also allows for easy export of the resulting POD curve and model parameters for further processing and analysis.
Reliability
Find and fit the optimal probability distribution to data for reliability analysis
04
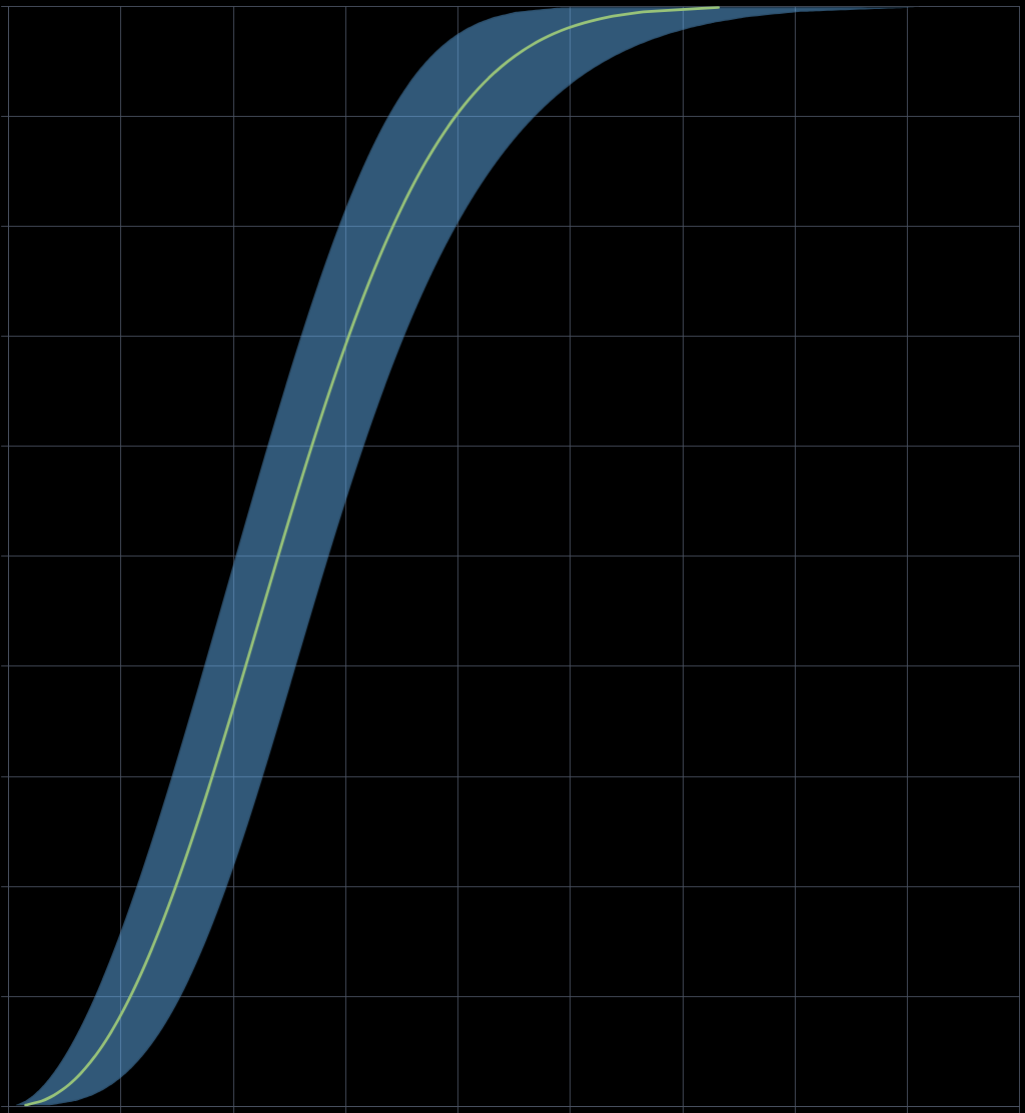
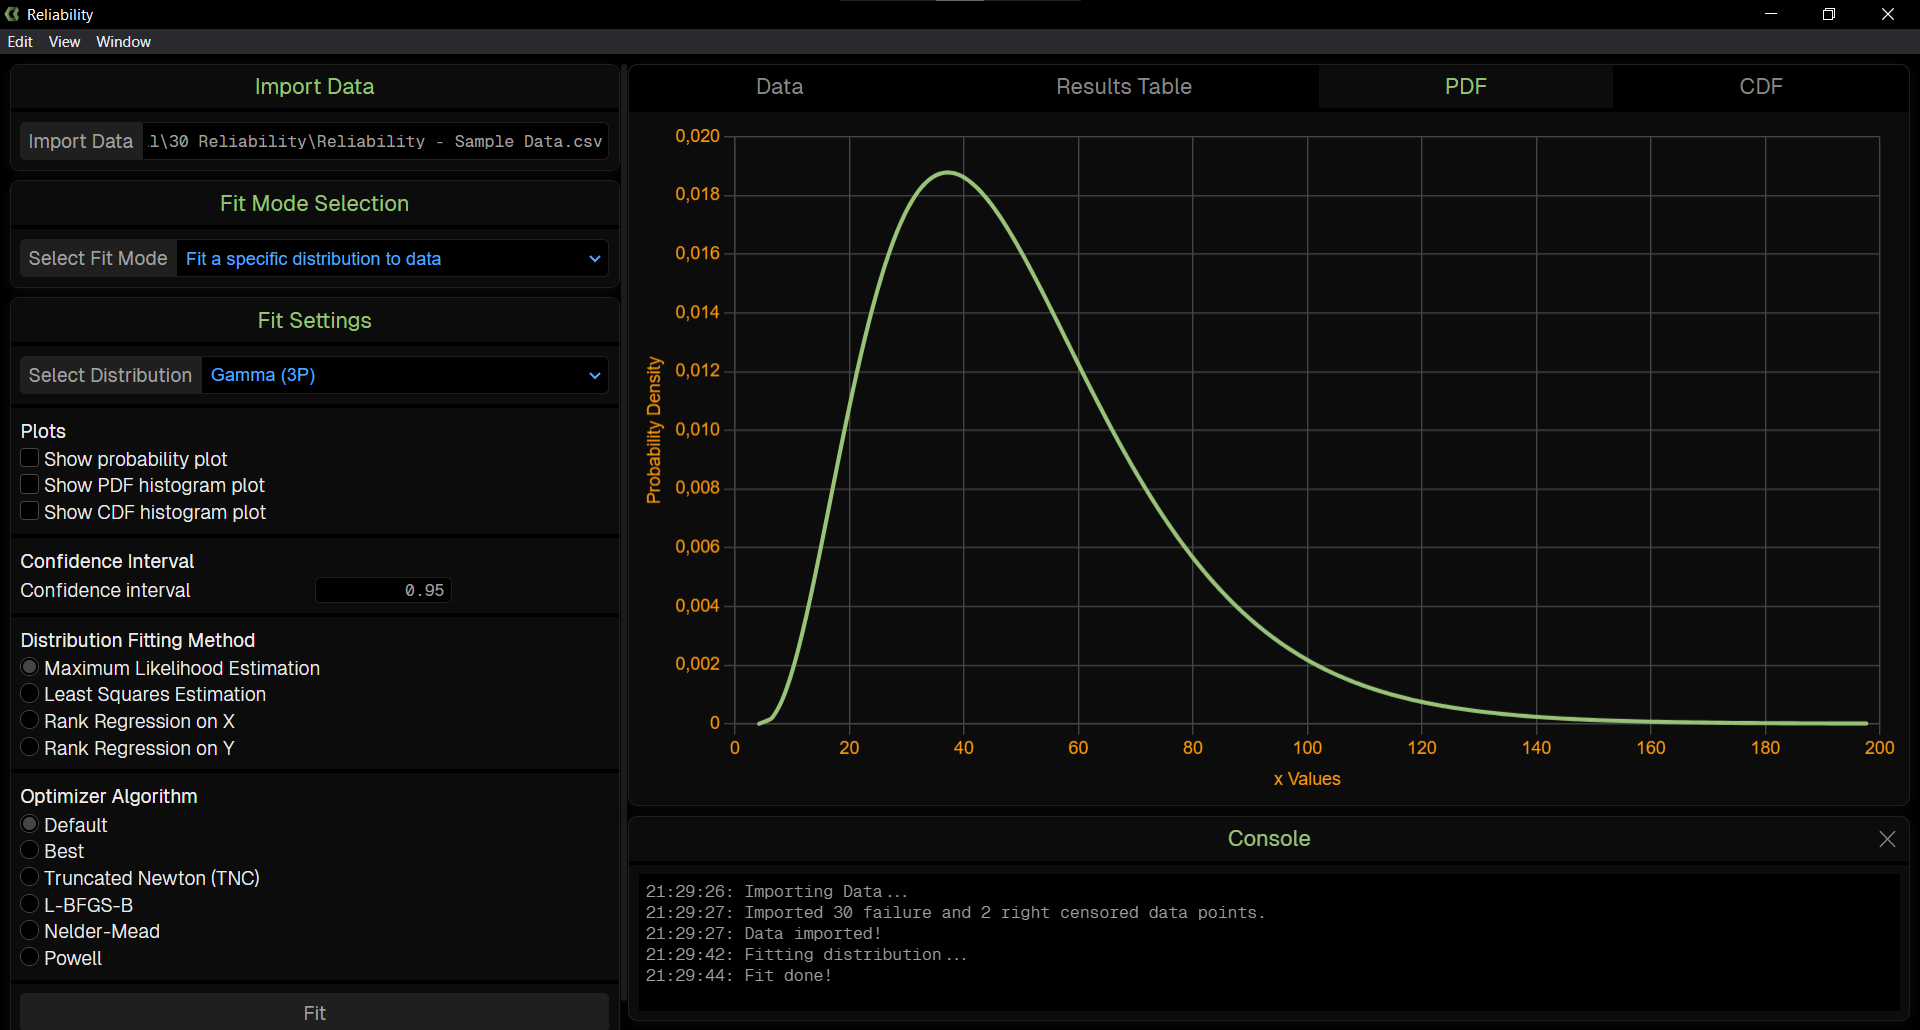
An important aspect of structural reliability analysis is describing variations in observed data with a probability distribution [USAF-Aircraft Reliability HDBK]. Reliability is a tool which aids in determining the optimal probability distribution to model variability in a set of observations (test data).
StrainLife
Fit Ramberg-Osgood and Coffin-Manson coefficients to strain-life test data
05
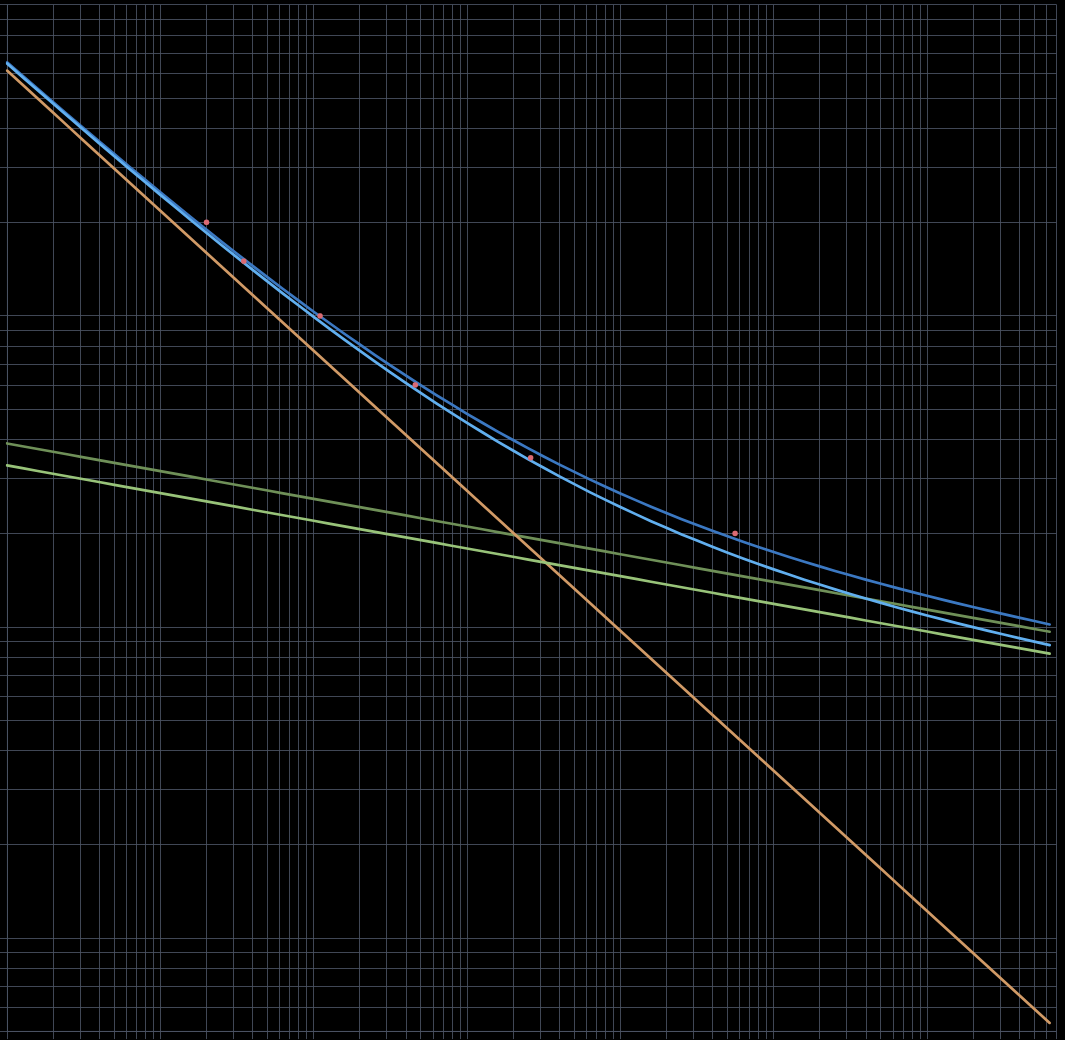
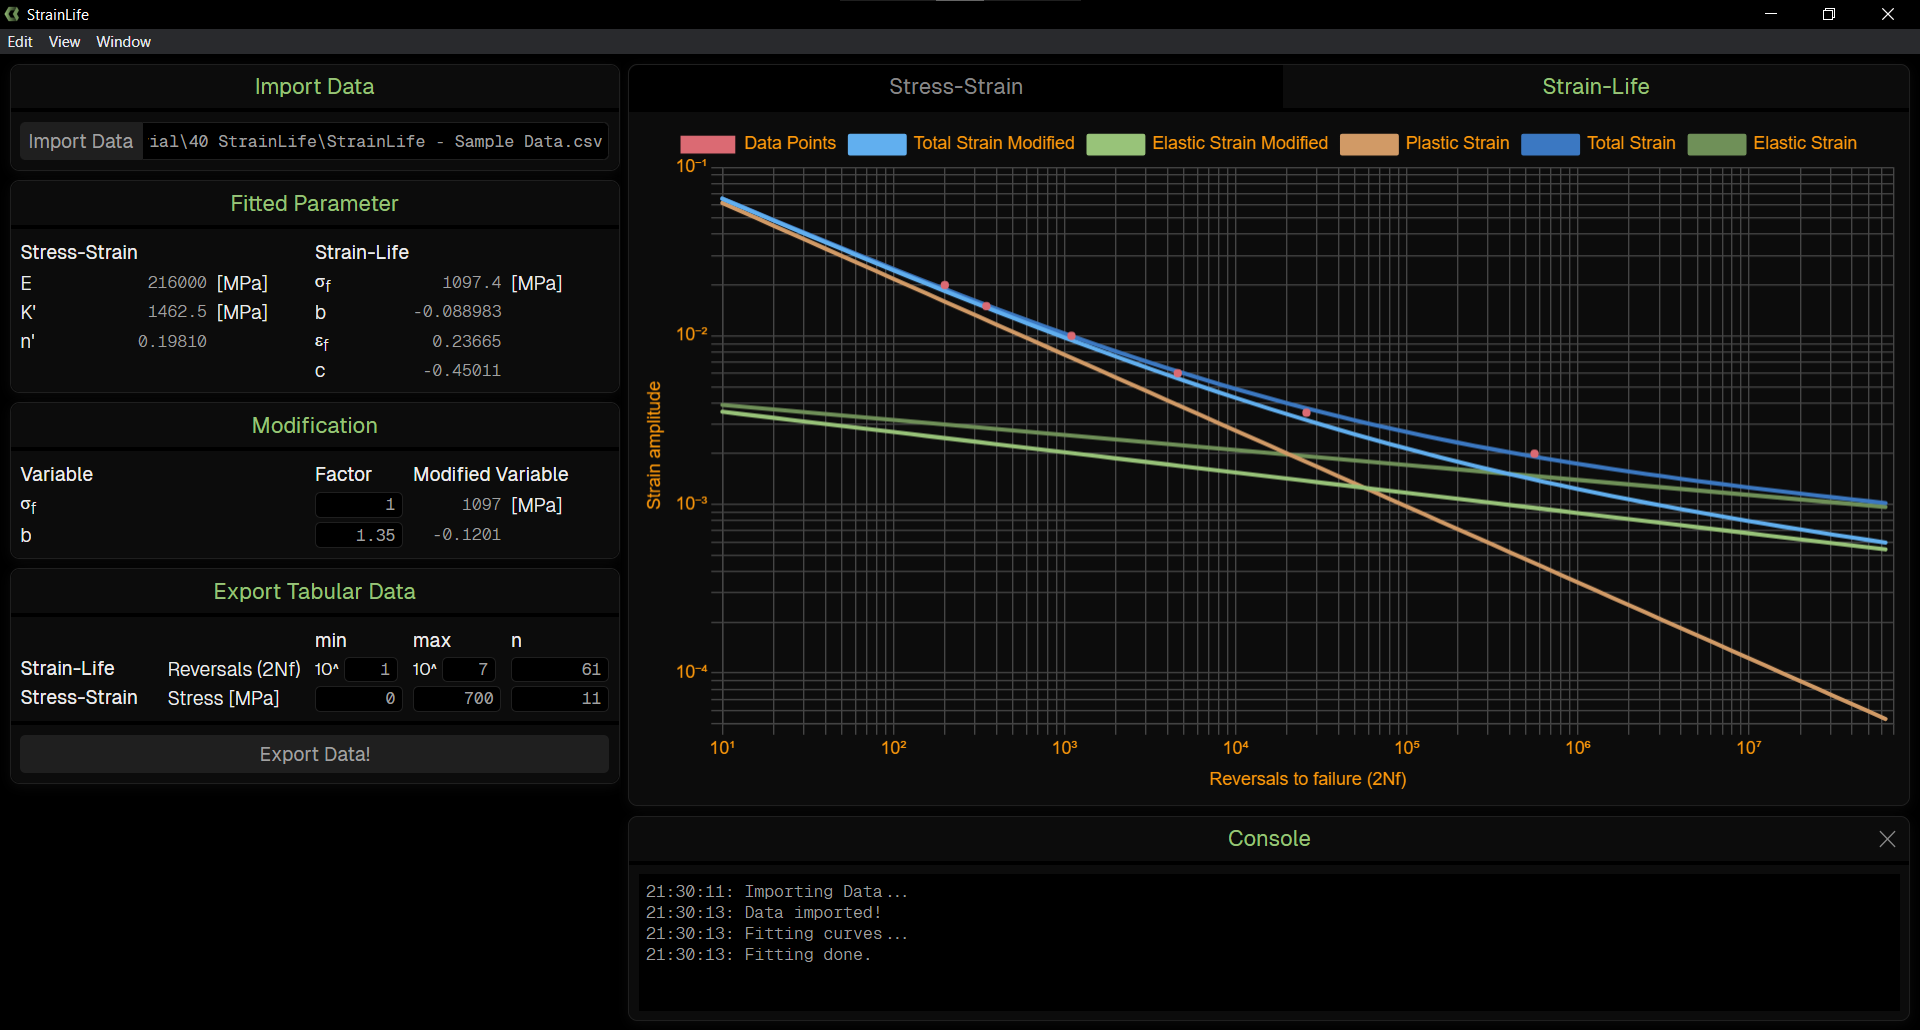
StrainLife is a tool for fitting the Ramberg-Osgood and Coffin-Manson coefficients to strain-life test data. The tool provides a graphical representation of the fitted coefficients and the input data, allowing users to visualize and assess the quality of the fit.
CurveFit
Curve-Fitting tool for fitting a variety of functions to data
06
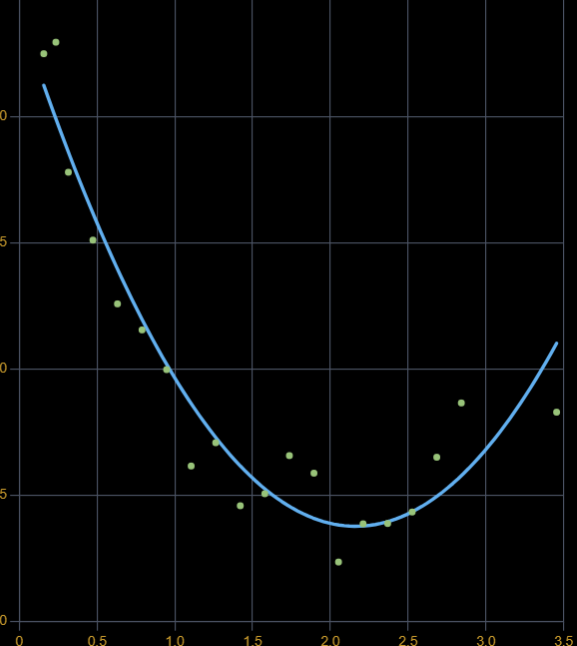
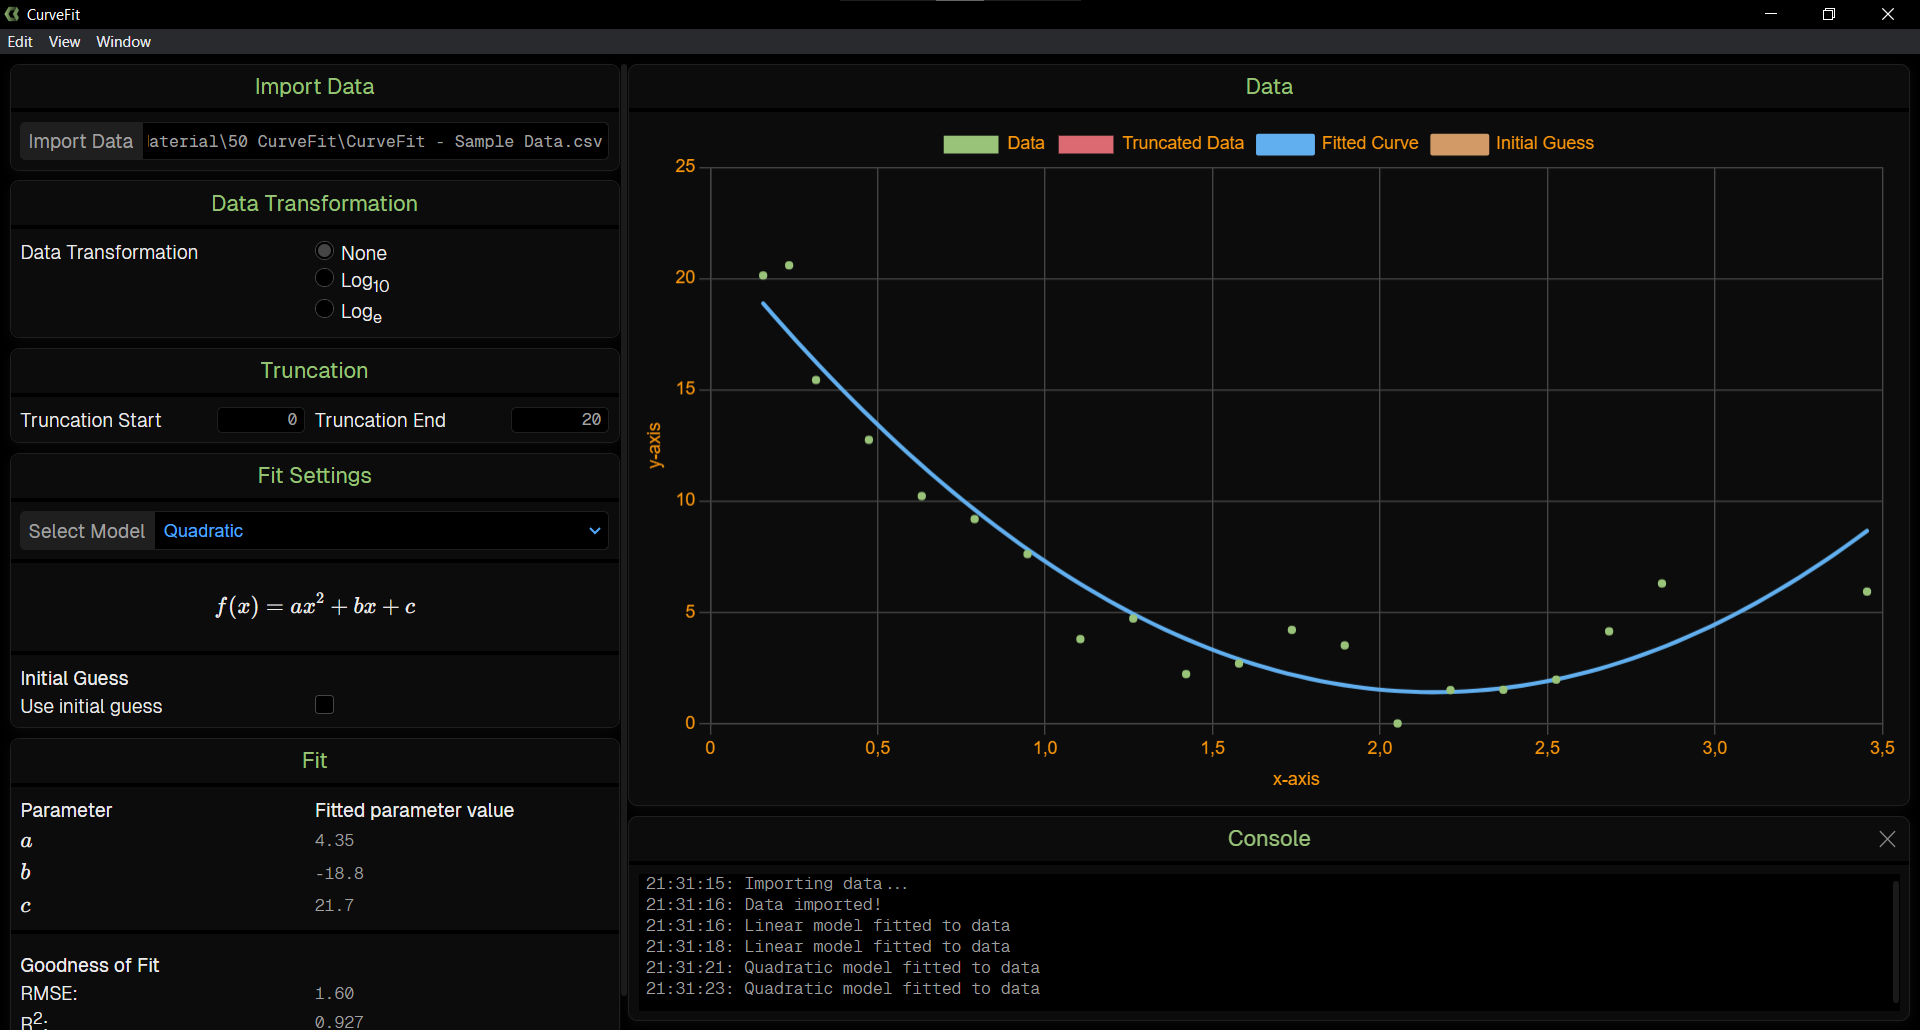
CurveFit is a tool designed for quick and efficient curve fitting. It supports a variety of functions, including linear, polynomial, exponential, logarithmic, and power functions. With its user-friendly interface, users can easily input data, select the desired function, and quickly get the fitted function parameter returned. The tool also provides a graphical representation of the fitted function alongside the input data, making it easy to assess the quality of the fit.
Tools in the pipeline
(07)
Monte Carlo Simulator
The Monte Carlo Simulator is a tool that can be used to simulate the response of a system with uncertain or probabilistic input parameters. A practical use case for the tool would be in selecting or sizing components, subject to varying use case scenarios or loading conditions (e.g., wind loads, payload, etc.).
The tool generates random samples from the input distributions and calculates the output response taking into account the relationships between the different input parameters.
(08)
Your Idea
Do you have an idea for a tool that you would like to see in the Structural Integrity Toolbox? Let me know! I am always looking for new ideas and ways to improve the toolbox.
Impressions
Demo
Download the Structural Integrity Toolbox and see what it can do for you. Contact me at andre.gut@crinity.ch for a free trial-license key. I would be very happy to receive your feedback and suggestions.
Download